Fighting cancer with the help of mobile apps
Over the passed weekend (March 1st through 3rd 2013) we took part in the Cancer Research Institute's hackathon at Google Campus.
As with anything new we have tasked ourselves to create, we started to brainstorm ideas while constantly asking following questions:
- Who is the target player for the game
- What gameplay would nudge player to play in a way that helps research
- What mechanics should we implement to encourage players’ to return to the game
Using open data analytics from Flurry Analytics as well as our analysis of the top positions in the app stores, we have come up with pretty obvious results – generally, there are two groups of players:
- Hardcore gamers: mostly males 18-34, playing shooters, arcade, racing simulator. Typical usage: short bursts on the go and whenever there’s an urge to play. Behaviourally, they aim to finish the game or get the best score to beat friends/top players. They are early adopters of all new games, but they hardly form loyalty
- Casual gamers: mostly females, and males 34+ playing management, turn-based, cards, match-3, bingo/slots types of games. They play in more relaxed setting, taking time to make decisions in game. These games are almost a meditative experience.
Below is a is a matrix that shows how type of game determines loyalty and frequency of use by players (source: Flurry Analytics blog)

Below, is player's gender and age by game genre.

What we have observed during the last 24 months is quick rise and firm grip of the top positions by the casual games: e.g. Candy Crash Saga, Hay Day, Clash of Clans, 4 words 1 pic , etc. Reasons for that are obvious: there’s no rush, no need to take action immediately (i.e. games of this type are not a test of reflexes).
Since 80% of top games are casual ones, we can deduce that casual gamer makes around 80% of total audience these days. What’s more important is that this type of gamer is more probable to become a loyal player of a specific game.
We have considered what type of player and, consequently, type of game, would bring better long-term results for UK Cancer Research. Considering our analysis we have decided think along the lines of a casual gameplay. This is reflected in the game ideas presented below.
Game Ideas
At the conceptual stage we decided to change the way we look at the raw data: rows and columns of numbers. Our first idea was to turn a rectangle into a circle and display data points as a apartments with lights switched on.
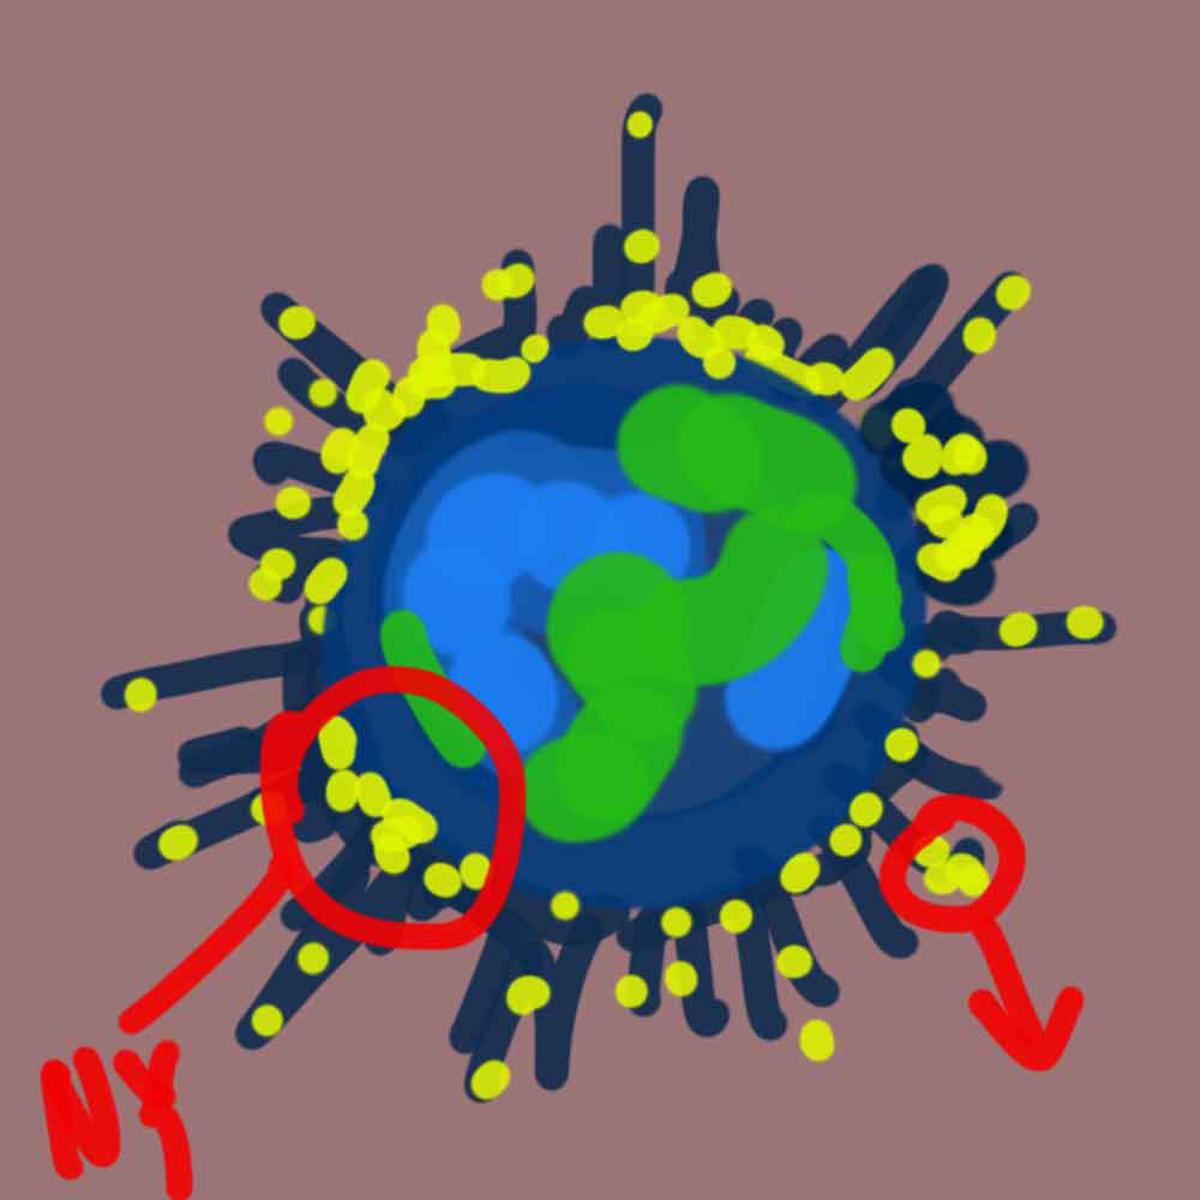
Game idea 1
Each sample of data would be given a name of a real city. Player traverses through the city by moving from one building . The player can move up and down the building to visit apartments and collect loot items. But she cannot move too far up or down as her energy depletes. After venturing out of city, player moves along the ground until she reaches a new city and conitunues playing. Here's how this game design is of interest for cancer researchers: the distance between the cities is the gap in the gene sequency numbering that researchers are looking for.
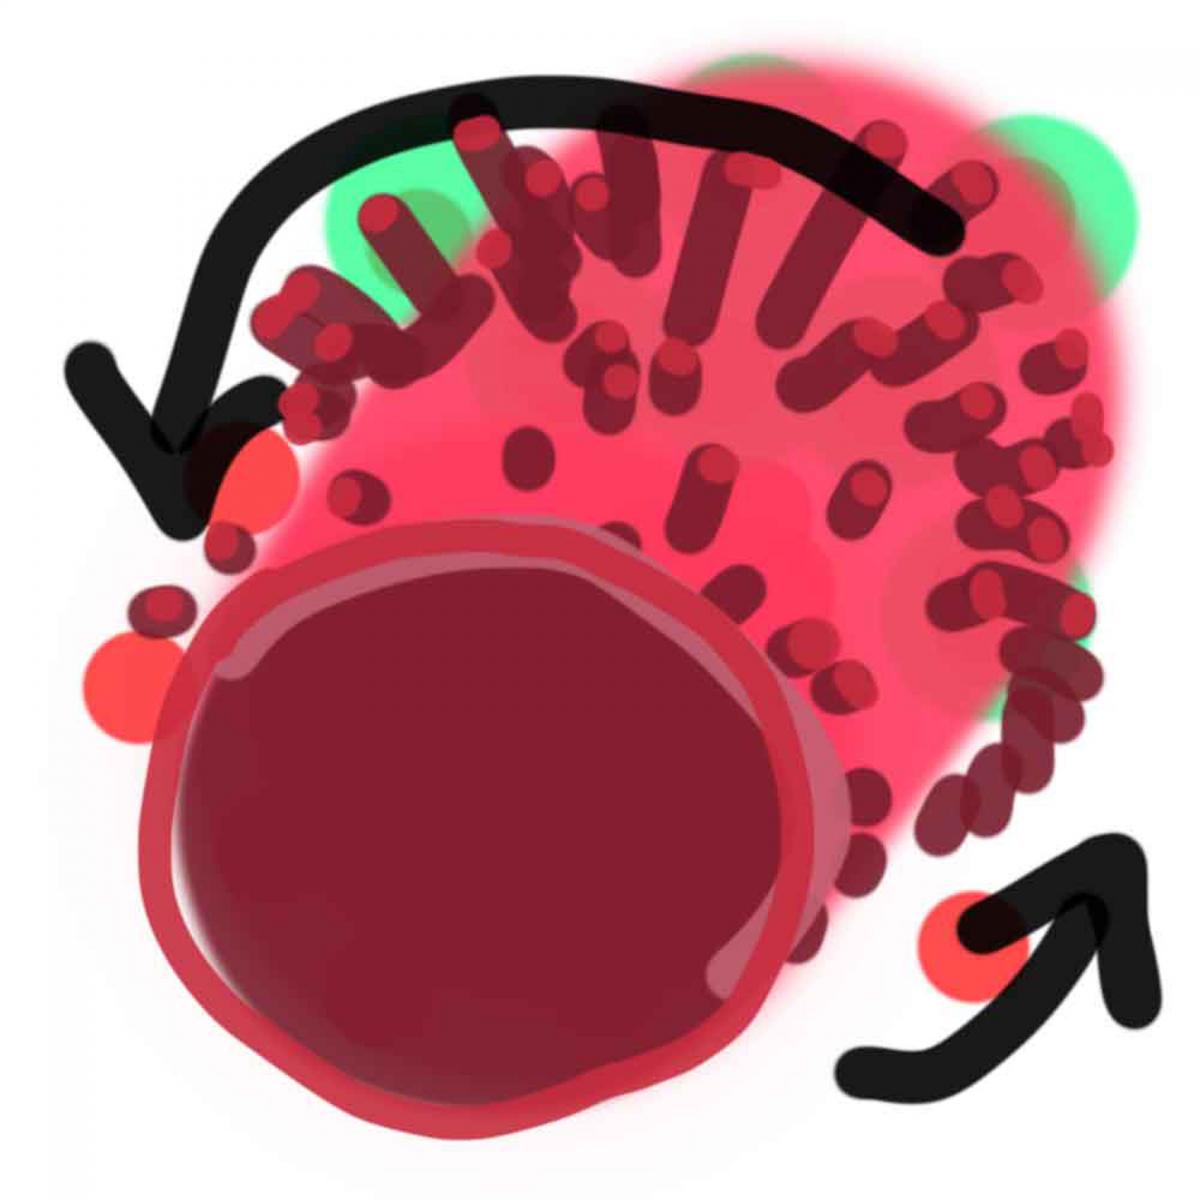
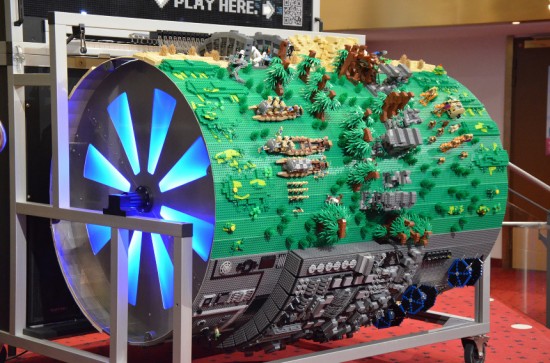
Next idea was to take yet another perspective on visualising data. This time, we turned it into a 3D world, where data points are placed on the cylinder in form of spikes. Surely, it is very possible to change spikes into more visually attractive game objects as is shown in Lego's music box image beneah a sketch.
Game idea 2
Let player roam the world by cutting off the spikes with highest concentration, thereby finding the line where the copy numbering errors occur.
Sketch
One approximate of how the game world could look like: Lego's music box
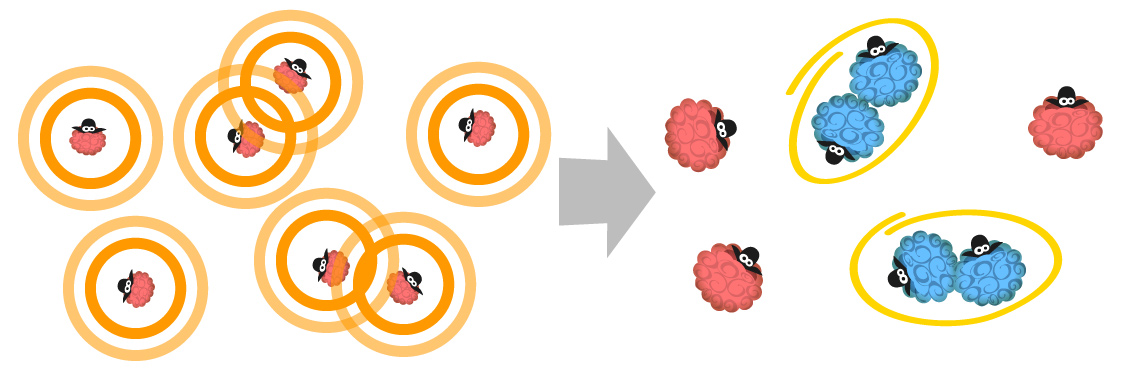
The third idea -- actually it came up earlier during brainstorming, but we decided not to get attached to it and moved on in search of new ones -- came from realisation that data points are there to be collected into groups, clusters. And while computer algrothim may miss whether points belong to clusters or not, human brain is much better at detecting if something belongs to group or not. It is also a variation of the game of GO -- territory control.
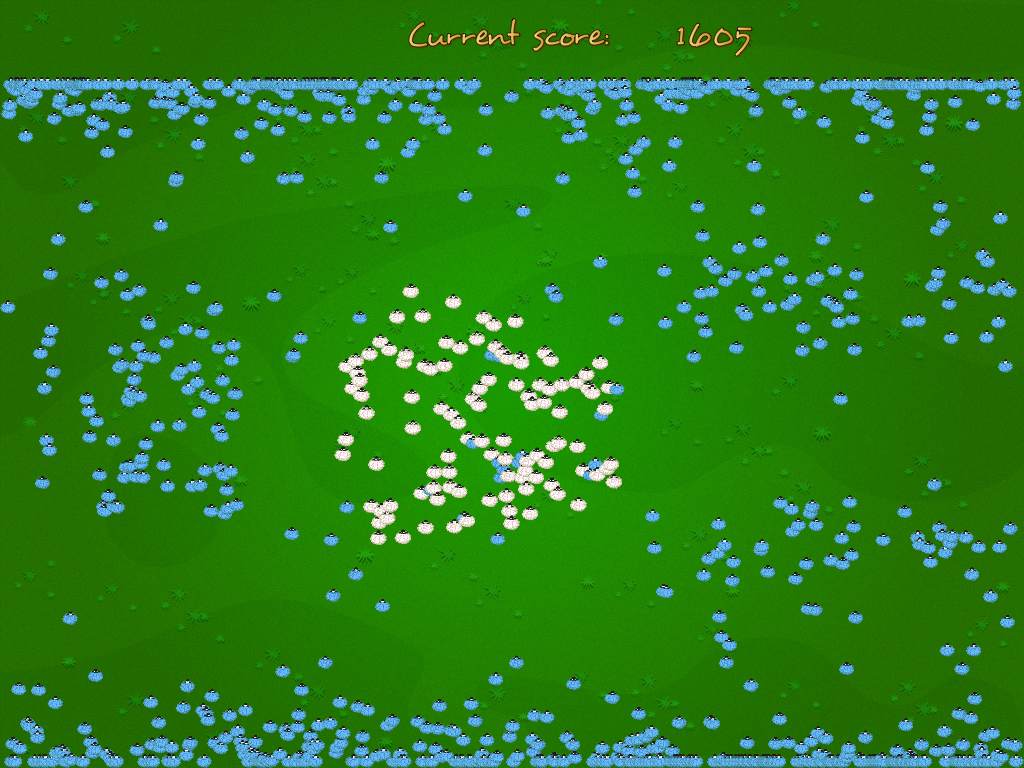
Game idea 3
Present data points as free roaming sheep wonders around the field. Your task is to collect/flock as many sheep as possible. There are several limitations, of course, to make game more strategic:
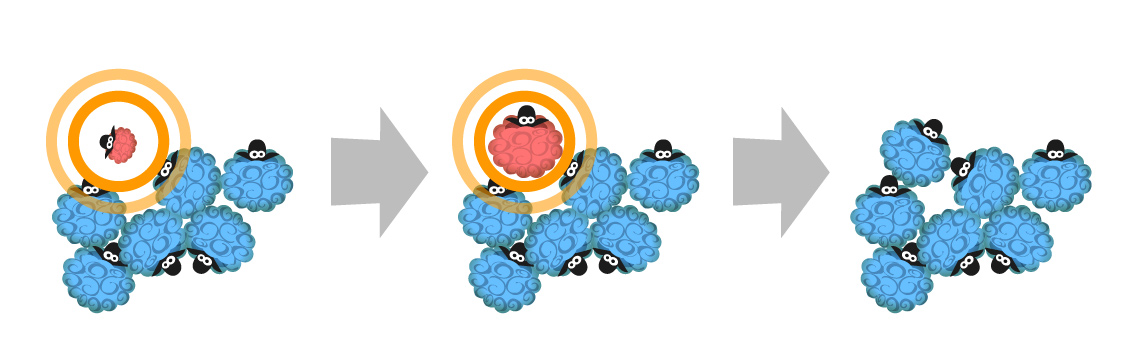
- Sheep at the edges has lowest value, sheep in the centre has highest value
- Player starts with adding one sheep to her flock and then can add only sheep in a short radius around the flock
Data is spread across many levels that you can play in several modes: single player, vs AI, and vs other players on a turn-base playing on several level simultaneously. Because data is so different even across one gene, every level feels like a new fresh experience.
Players would able to start/join clans of flock masters and fight other clans for the highest number of sheep!
There are several things that make this game a good (I’d even say ‘great’, but I’m biased) fit for a cancer research project or, for that matter, in any research project that requires analysing clusters of information:
-
Gameplay encourages player to cluster data points that are visually are closest. So you could expect all non clustered data does not belong to a trend line. Another benefit of clustering is that starting and ending edges of trend line are now clearly defined as players collect all sheep (data points) in the same flock.
- Challenging and accomplishable goals in each new level make game addicting and ensures retention over time. Players may even replay some levels with a new tactical approach to try and score better result.
- It has the potential to become a globally popular game thus accelerating research several times over.
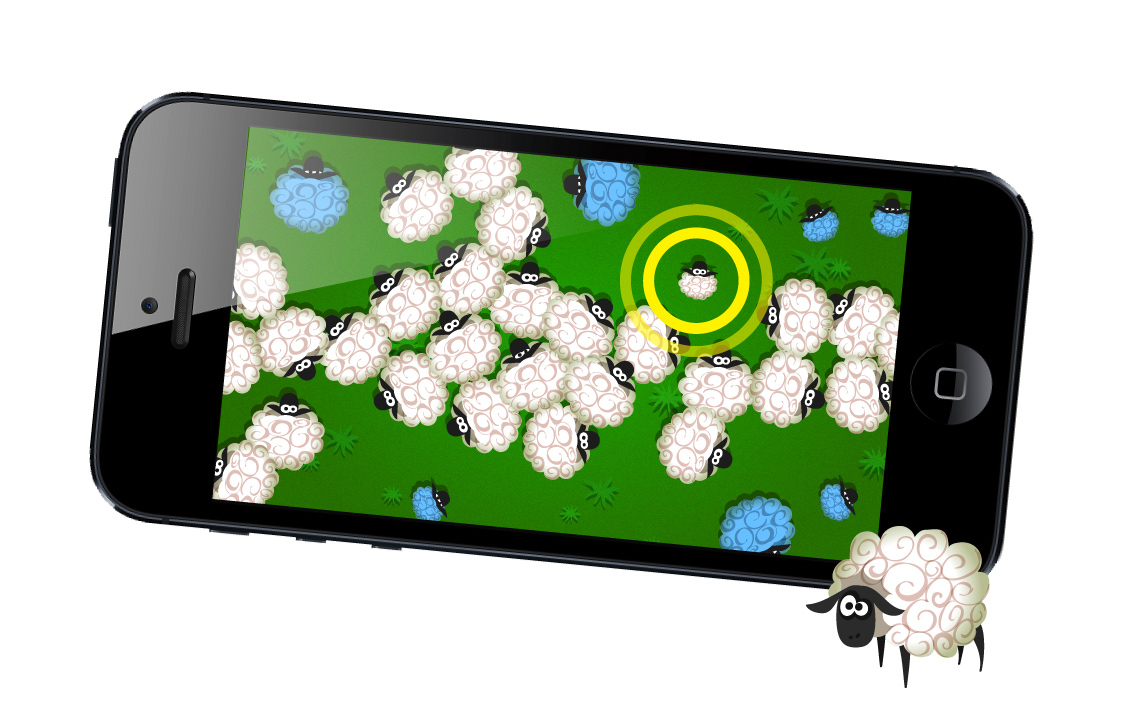
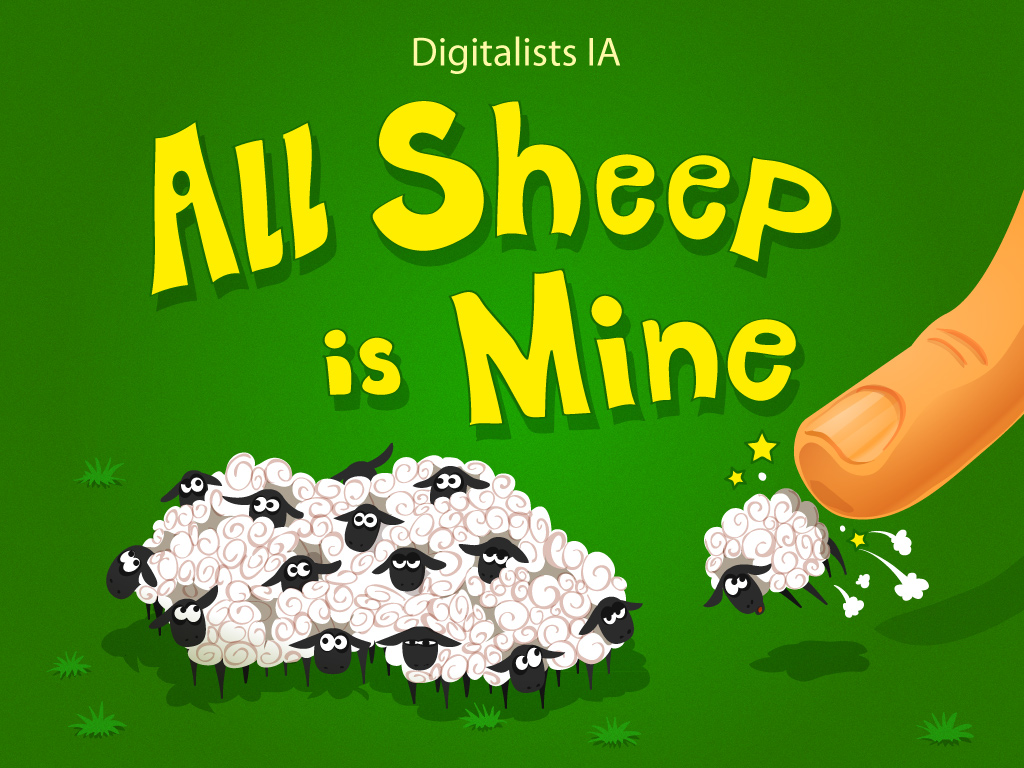
- It has a cheeky name ' All Sheep Is Mine '
- The prototype has been coded in Adobe Air (a cross platform version of Flash/ActionScript), which means the app can be launched for Android and iOS smartphones and tablets as well as on the social networks like Facebook with little change in the underlying code.
Wer
The reason you see lots of sheep congregated along top and bottom is because their position is taken from the raw data. We can cut off top-lower 5-10% this there's hardly any abnormality among those data points.